Shifting Blackjack Probabilities: The Impact of Card Depletion Over Multiple Rounds
Olivia Keller · Jul 20, 2026
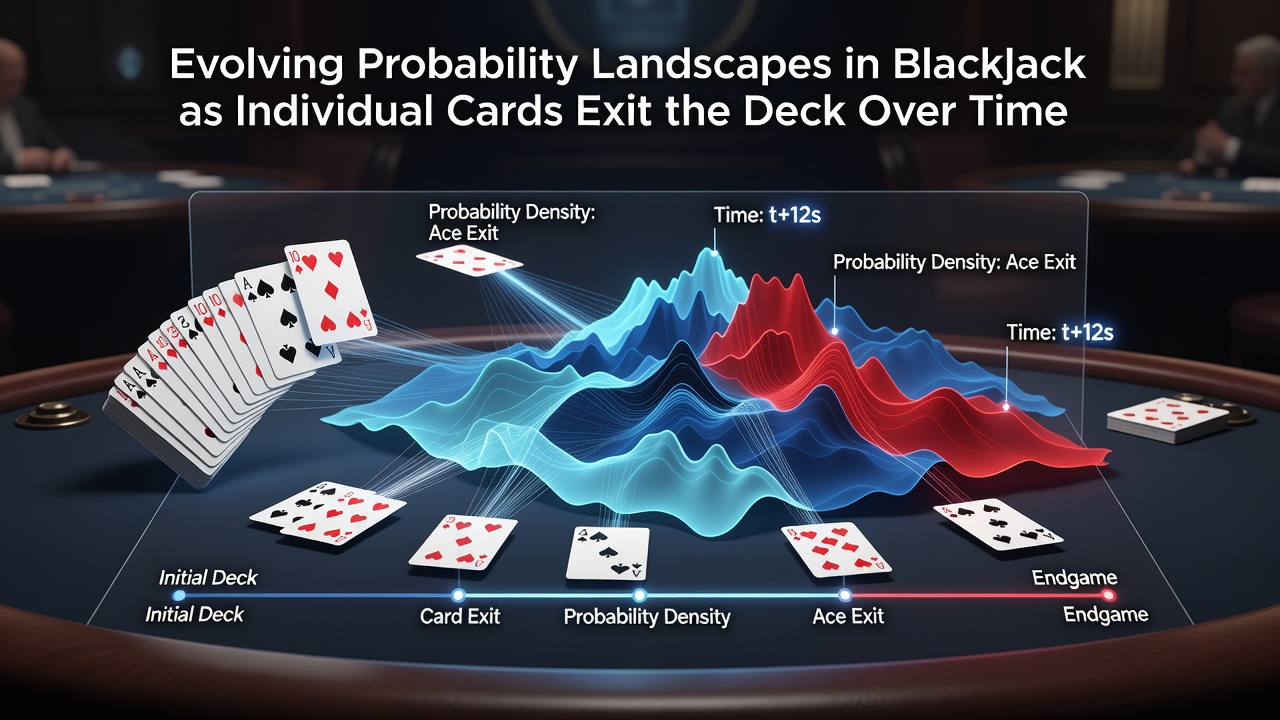
Shifting Blackjack Probabilities: The Impact of Card Depletion Over Multiple Rounds
Blackjack begins with a fixed set of probabilities determined by the initial deck composition, yet these values change steadily once cards leave the shoe and enter play. Observers note that each removal alters the remaining distribution, which in turn modifies the odds for player hands, dealer outcomes, and optimal decisions at the table. Data from extended sessions across multiple casinos indicate that the magnitude of these shifts grows more pronounced as penetration deepens, particularly in games that use six or eight decks.
Researchers tracking card removal effects have documented how the absence of high-value cards such as tens and aces reduces the frequency of blackjack payouts and strong starting totals, while the depletion of low-value cards increases the likelihood of dealer busts on stiff totals. Studies conducted in controlled laboratory settings confirm that these adjustments occur incrementally, with measurable impacts appearing after roughly one-quarter of the shoe has been dealt. Figures compiled during live play in Nevada facilities reveal similar patterns, although real-world variables such as multiple players at the table accelerate the rate of change.
Initial Deck Composition and Baseline Odds
At the start of a fresh shoe, the probability of receiving any specific card remains uniform across the remaining ranks. This equilibrium supports standard strategy charts that assume full decks, and it produces predictable long-term returns when players follow basic strategy without deviation. Once the first few cards exit, however, the ratios begin to tilt. For instance, removal of a single ace immediately lowers the chance of forming a natural blackjack on the next round, while removal of a five slightly elevates the odds that a dealer holding sixteen will bust.
Multi-deck games buffer these early changes because the proportional impact of one card stays small relative to the total. Yet even in eight-deck shoes, cumulative effects become noticeable after thirty or forty cards have been seen. Analysts who reviewed surveillance data from Atlantic City properties in 2025 found that player edge calculations diverged from baseline values by 0.3 to 0.7 percent once penetration reached 40 percent, depending on the mix of cards removed.
Progressive Changes During Extended Play
As rounds continue, distinct patterns emerge based on which ranks leave the deck. High-card depletion tends to favor the house because players lose opportunities for strong totals and blackjacks, whereas low-card depletion can shift advantage toward skilled participants who adjust their decisions accordingly. Continuous monitoring equipment installed in several California cardrooms during early 2026 has captured these transitions in real time, showing that the frequency of double-down opportunities on ten-value cards rises measurably when fives and sixes have already been played.
Dealers who rotate through multiple tables report that shoes rich in remaining tens produce more frequent player decisions to stand on marginal totals, while shoes depleted of tens prompt more aggressive hitting. These behavioral adjustments reflect the updated probabilities rather than any change in the underlying rules. Simulations run by independent laboratories demonstrate that the expected value for a hard sixteen against a dealer ten increases by approximately 1.8 percent when the remaining deck contains 15 percent fewer tens than the starting composition.
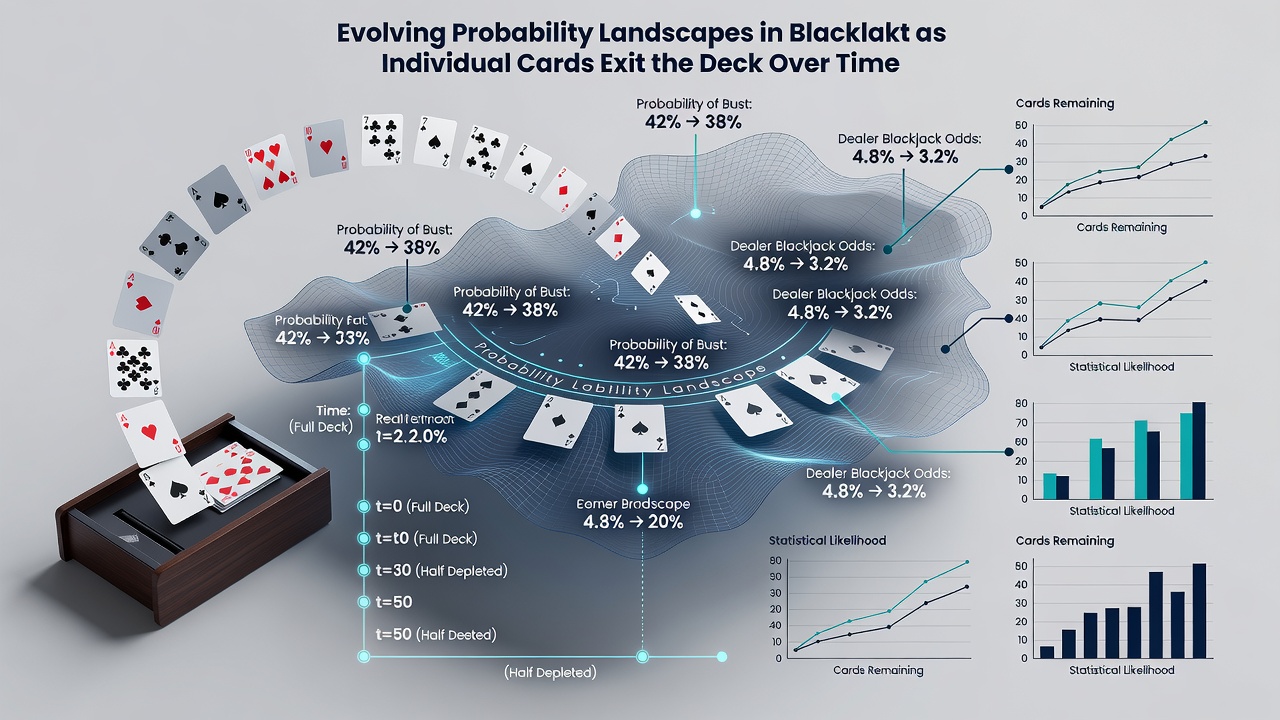
Measurement Tools and Data Collection Practices
Casino operators and regulatory bodies employ automated systems to log card sequences and compute running probability matrices. These tools integrate with table management software so that floor supervisors can observe aggregate trends without interrupting play. According to reports published by the Nevada Gaming Control Board, penetration thresholds above 60 percent correlate with the widest variance in per-round expected values across different shoe compositions. Similar findings appear in analyses released by the Australian Gambling Research Centre, which examined comparable multi-deck formats used in that jurisdiction.
Players who track removal effects through mental counts or electronic aids encounter the same evolving landscape, although house rules on such devices vary by property. Research conducted at the University of Nevada, Las Vegas, during 2025 sessions illustrated that accurate real-time adjustment requires accounting for both the number and the rank distribution of cards already seen, rather than simple running totals alone. The resulting probability surfaces display local maxima and minima that shift after nearly every round, creating a dynamic decision environment rather than a static one.
Regional Variations in Deck Management
Different jurisdictions apply distinct rules governing how many decks enter the shoe and how deeply dealers penetrate before shuffling. Canadian provincial regulators, for example, have mandated minimum shuffle points in several provinces that limit the extent of depletion compared with certain U.S. markets. These constraints moderate the scale of probability drift observed in those venues. European operators, meanwhile, often employ continuous shuffle machines that reset the probability landscape after every hand, thereby eliminating cumulative removal effects entirely.
Where traditional shoe games persist, the interaction between table minimums and session length further influences how far probability landscapes evolve. Higher-limit tables tend to see fewer hands per shoe because players deliberate longer, which slows the rate of card removal and keeps probability shifts smaller. Lower-limit tables generate more rapid depletion and correspondingly larger swings in per-hand expectations.
Conclusion
The probability structure of blackjack undergoes continuous revision each time a card leaves the deck, and these revisions accumulate into measurable differences in expected outcomes as play progresses through a shoe. Documentation from regulatory agencies, academic studies, and operational data all confirm that the direction and magnitude of change depend on the specific ranks removed and the depth of penetration reached. Operators adjust procedures accordingly, while analysts continue to refine models that capture the evolving nature of these odds in real time.